
Semantic Layer for Big Data
Self-service analytics on big data — governed by IT, loved by users.
XLTable is an XMLA-compatible OLAP semantic layer for ClickHouse, Snowflake, BigQuery, Databricks, StarRocks, Trino, Greenplum, and DuckDB. Define your metrics once, under IT control with fine-grained access — then let thousands of users explore them in Excel PivotTables or ask questions in plain language through AI. No SQL for end users. No data copies. Deploys inside your perimeter.
SELECT region, quarter, SUM(sales_amount)2.0B rowsClickHouse0.3s
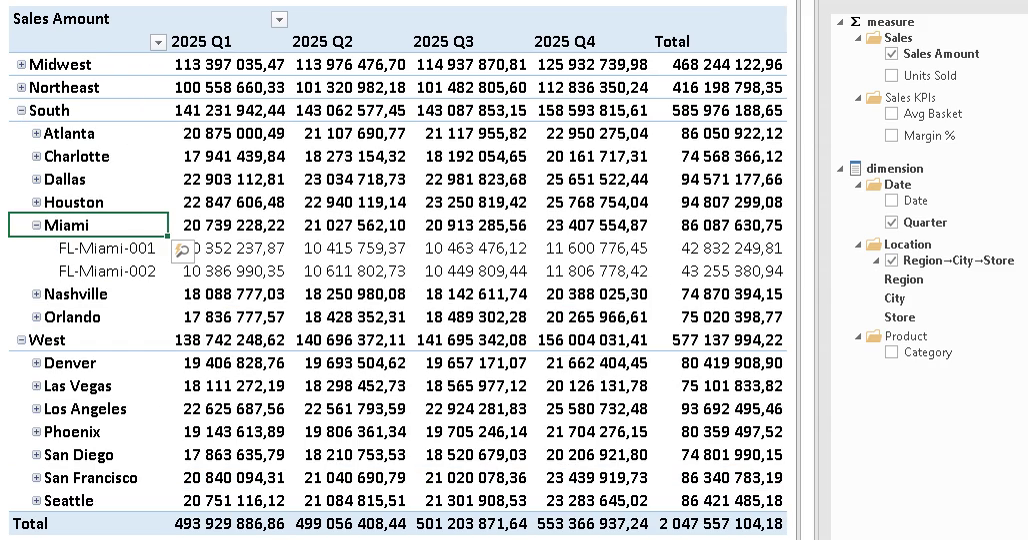
Excel PivotTable · live over XMLAno data copies · on-prem
The Reality
Your users end up in Excel anyway
You rolled out dashboards. You bought licenses, ran trainings, built self-service portals. And still — every report ends its life as an Excel export on someone's desktop.
That's not a failure of your team. It's how people actually work. XLTable stops fighting it: instead of pulling users out of Excel, it connects Excel — live — to the big data in your warehouse, through one governed semantic layer.
Excel becomes the front end. Your warehouse stays the single source of truth.
Semantic Layer
What is XLTable?
XLTable is an XMLA-compatible OLAP semantic layer built for modern data warehouses. It exposes your data through the XMLA protocol, so Excel sees it as a familiar OLAP cube: MDX queries, PivotTables, hierarchies — everything works as expected. Define your metrics and dimensions once in the semantic layer, and analysts explore them freely. No SQL for end users, no data duplication. Backends include ClickHouse, Snowflake, BigQuery, Databricks, StarRocks, Trino, Greenplum, and DuckDB. Coming from Microsoft Analysis Services? XLTable is a drop-in replacement.
Two Interfaces
One model, two ways to explore
Excel
Excel for analysts
Native PivotTables over XMLA. Drag-and-drop, no SQL, no retraining. Excel connects like it would to Analysis Services — but the data lives in your warehouse.
AI
AI for questions
Ask your data in plain language. XLTable ships an MCP server that connects Claude and other AI assistants straight to your cubes. The assistant sees what you're doing in Excel — same session, one continuous analysis. And because both interfaces read the same semantic layer, the numbers always agree: ask the chat for Q4 margin and you'll get the exact figure your PivotTable shows.
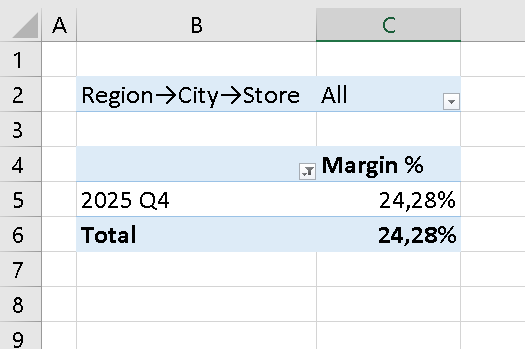
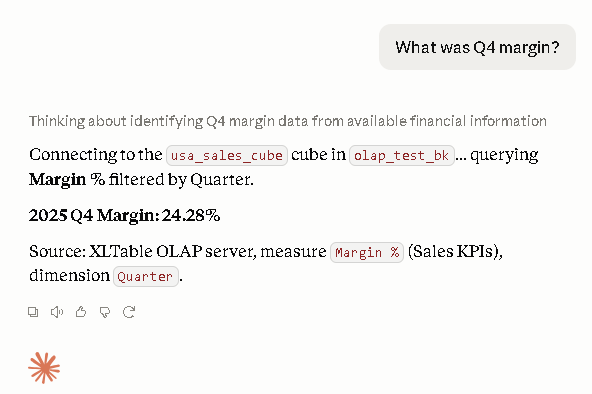
One semantic layer — both interfaces answer with the same number.
For Engineers
A semantic layer engineers actually want
Semantic layer as code
Cube definitions are plain SQL files. Keep them in Git, review changes in pull requests, deploy through the CI/CD flow your team already uses. No black-box UI — your semantic layer lives in the repo.
AI-authored models
Don't just query the layer with AI — build it with AI. XLTable generates cube definitions from your tables automatically, so you go from raw schema to a working model in minutes, then refine it in Git like any other code.
Architecture
How XLTable works
XLTable sits between Excel and your analytical databases, translating MDX into SQL and returning aggregated results directly to PivotTables.
- 01Define data sources. Connect ClickHouse, Snowflake, BigQuery, Databricks, StarRocks, Trino, Greenplum, DuckDB or other SQL engines.
- 02Model measures & dimensions. Use SQL to define cubes.
- 03Connect Excel via XMLA. No plugins, no extensions — Excel connects natively.
- 04Explore data in PivotTables. Users drag-and-drop; XLTable handles SQL.
Data Flow

Excel

XLTable

ClickHouse
-- Excel asks in MDX
SELECT {[Measures].[Sales Amount]} ON 0, [Region].Members ON 1 FROM [Sales]
-- your warehouse receives SQL
SELECT region, SUM(sales_amount) FROM sales GROUP BY region
Capabilities
Features & benefits
Excel-native analytics
Users stay in Excel. No retraining.
Big Data backends
ClickHouse, Snowflake, BigQuery, Databricks, StarRocks, Trino, Greenplum, DuckDB and others.
No SQL for end users
Model once; explore everywhere.
XMLA compatible
Works like Microsoft Analysis Services.
Flexible cube modeling
Define measures, hierarchies, and attributes.
Secure by design
Keep data inside your infrastructure.
Multiple measure groups, hierarchies, and dimensions
Combine multiple fact and reference tables into a unified analytical model.
LDAP / Active Directory integration
Manage authorization through enterprise AD groups with seamless role mapping.
Fine-grained access control
Restrict user access to specific measures, dimensions, or individual members.
Backends
Supported databases
Any SQL backend that supports aggregation can be used as a data source.

ClickHouse
Snowflake
BigQuery

Databricks

StarRocks

Trino

Greenplum

DuckDB
Deployment & Security
Built for corporate and banking environments
Your data never leaves.
XLTable pushes queries down to your warehouse — no extracts, no in-memory copies, no data shipped to anyone's cloud. Deploy on-premises or fully air-gapped. Even the AI interface can run on locally hosted models — no cloud APIs required.
Self-service, governed.
Fine-grained access control down to rows and members, LDAP / Active Directory integration, one set of metric definitions for everyone. Users get freedom; IT keeps control.
Light footprint.
One service in front of your warehouse — live in a day, not a six-month rollout. No cube storage layer, no heavy infrastructure to babysit.
Licensing
Pricing
Annual subscription in USD for international customers. Includes updates and support for the duration of the license.
Kazakhstan and CIS: separate price list in local currency — request a quote.
XLTable Desktop
Excel PivotTables and AI chat over your warehouse, on your own machine.
- Single user, runs locally
- AI chat over your data (MCP) included
- Unlimited data sources
- Cube files work unchanged on the server
- Email support
Pilot
Team validation before production rollout.
- Up to 10 users
- Unlimited data sources
- 1 environment
- Email support
- MCP for AI assistants: optional add-on
Business
Production-grade deployment for a department.
- Up to 50 users
- Unlimited data sources
- Dev + prod environments
- LDAP / AD + single sign-on
- Priority support with SLA
- MCP for AI assistants: optional add-on
Enterprise
Hundreds to thousands of users across the company.
- Per-seat pricing with volume discounts
- Large deployments: per-server licensing, unlimited users
- Multiple environments
- Dedicated support + SLA
- MCP for AI assistants included
All plans: on-premises or in your own cloud, air-gapped deployments supported. Server edition: 30-day trial in your own environment — ask for it with any plan. Perpetual licenses available on request.
Customers
What our customers say
"Before XLTable, our users hit serious limits working with large datasets in Excel. XLTable let us connect Excel directly to ClickHouse — no data duplication, no change to the familiar Pivot Table experience. We cut total cost of ownership by eliminating extra servers and simplifying development for analysts. Deployment took one working day with no lengthy training. The ClickHouse integration removes the need for additional BI servers, and the vendor support has been responsive and practical — exactly what you want when rolling out new tooling."

Stanislav Vilkov
Head of Analytics Tools · Lenta
Resources
Documentation
Full documentation is available on Read the Docs, including installation, configuration, cube modeling, and Excel integration.
- • Installation & deployment
- • Data source configuration
- • Cube modeling (measures & dimensions)
- • Jinja templates
- • Security & permissions
Blog
Latest articles
A Semantic Layer That Reads as SQL
Why a cube definition should be an executable SQL query, not a YAML description of one — and why that matters for your database, your team, and AI assistants.
Excel Is Still the #1 Self-Service Analytics Tool. Here's Why That's Not a Problem Anymore.
Why business users keep defaulting to Excel despite BI investments — and how a modern semantic layer turns this behavior into an architectural advantage.
Contact
Ready to bring Big Data into Excel?
Contact us for a demo, integration guidance, or support.
BR Systems LLP
Kazakhstan, Astana, Rakhymzhan Koshkarbayev Ave. 10/1, Unit 18, Z01F7K6
+7 705 964 9282